Turning complex data into a story people use.
The platform gave users access to a tremendous amount of audience and market information. The challenge was helping them move beyond charts and data points to understand what mattered, organize the story, and turn insight into something they could act on and share.
INDUSTRY
Enterprise analytics + audience intelligence
My role
UX strategy, research, journey mapping, product design
CORE CHALLENGE
Help users move from data exploration to a meaningful story
WHAT CHANGED
A more guided experience for finding, organizing, and communicating insights
The data was powerful. Making sense of it was the harder part.
Users could explore a large amount of information, but finding an interesting insight was only the beginning. They still had to determine what was important, connect related findings, build a coherent narrative, and communicate that story to someone else. That work often happened outside the product or depended heavily on the user’s own experience and analytical skill. The opportunity was to make the platform better at supporting the thinking that happens between finding the data and doing something with it.
What made this challenging
The experience exposed a lot of information at once
Users needed enough flexibility to explore deeply without losing track of what was relevant to the question they were trying to answer.
Insights did not automatically become a story
Individual findings could be useful on their own, but users still needed a way to connect them into a clear narrative.
Different users approached the work differently
The product needed to support exploration and expert analysis while also helping less experienced users understand where to begin and what to do next.

WHY THIS WORK MATTERS
Good analytics UX does more than display data.
The value of an analytics platform is not the number of charts it can produce.The value comes when people can understand what they are seeing, recognize the important patterns, and communicate those insights in a way that supports a decision. This project focused on closing the gap between analysis and storytelling.
Design around the work users were actually trying to complete.
The goal was not to simplify the analytics themselves. It was to make the larger workflow around them more coherent.
Understand how people worked with the data
Research the ways users explored information, identified meaningful findings, and moved from analysis into communication.
Connect analysis to narrative
Explore ways the product could help users capture important findings, organize them, and build a more coherent story as they worked.
Identify where the workflow broke apart
Look for the moments where users had to leave the product, remember what they had found, manually connect insights, or reconstruct the story later.
Help people move from insight to action
Design an experience that made it easier to review the story, communicate what mattered, and use the analysis to support a decision.
How analysis became a story
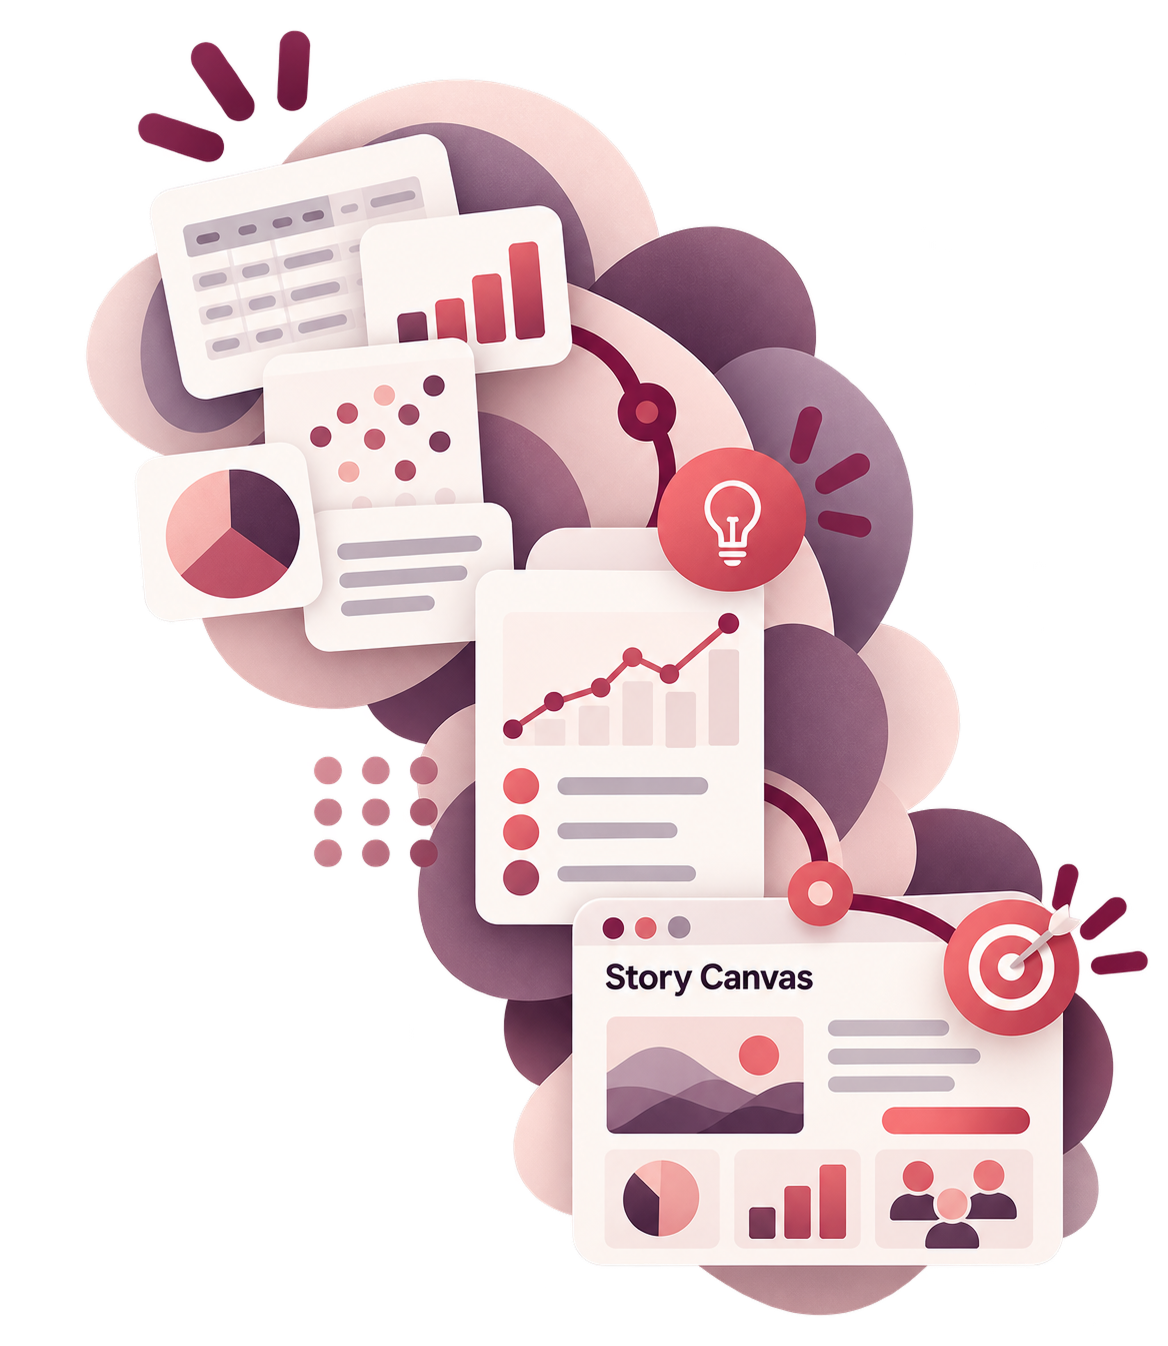
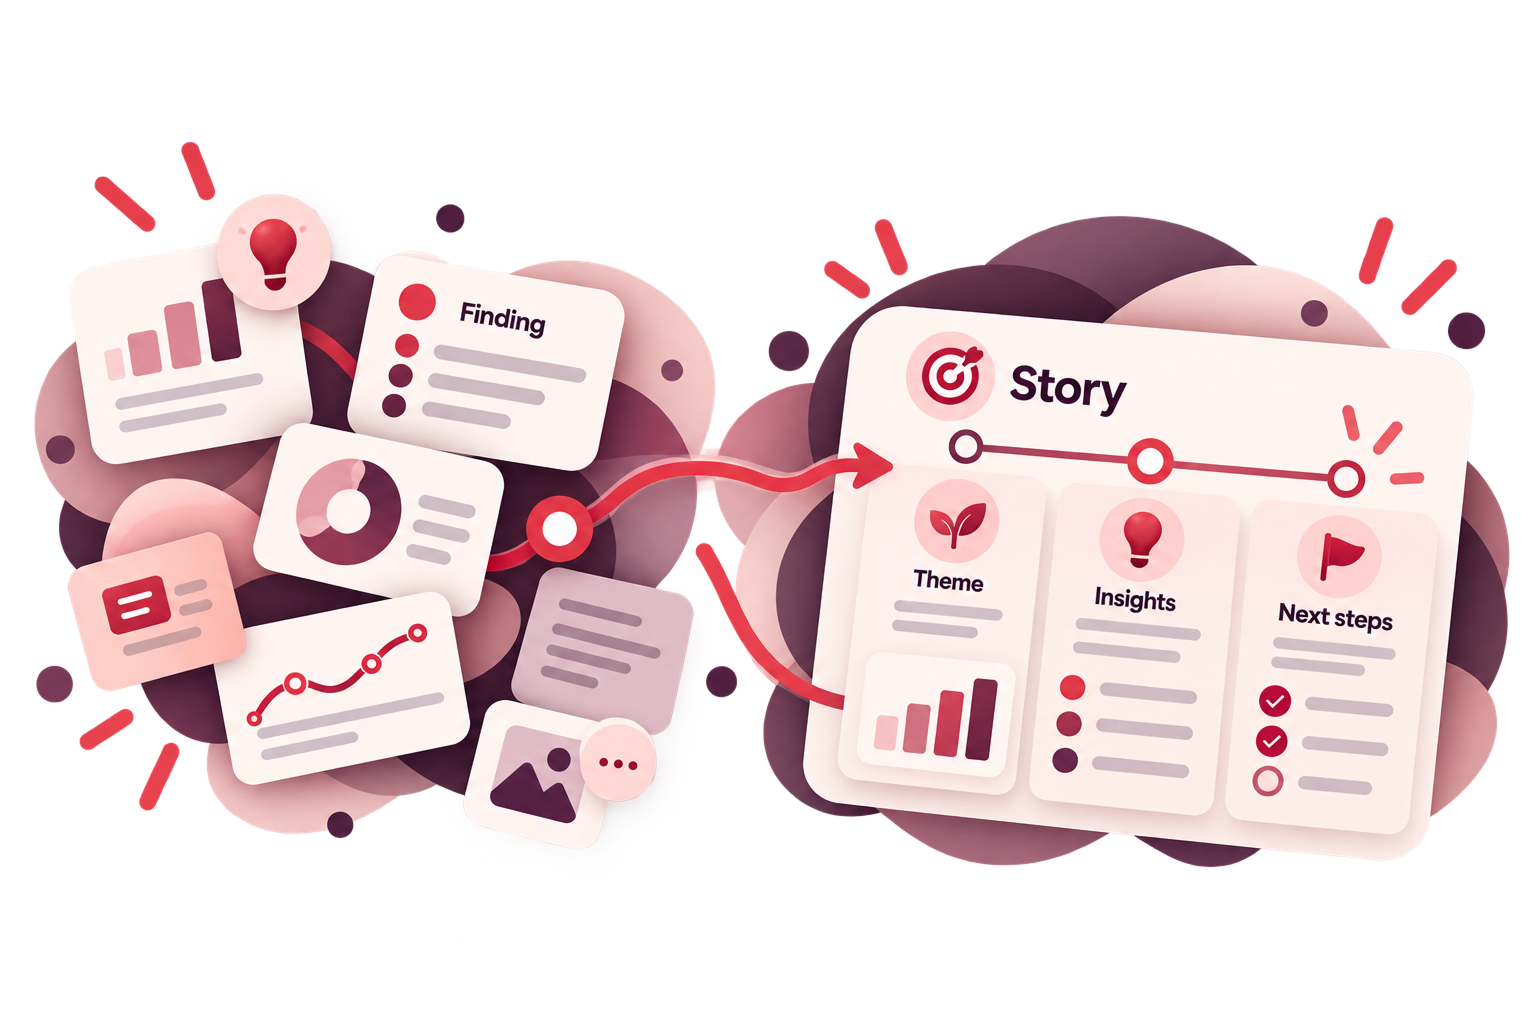
Building the story as insights emerged
Instead of treating each chart or finding as an isolated endpoint, the experience gave users a place to capture what mattered and begin organizing those insights into a larger narrative. That helped preserve the context behind the analysis while the work was still happening.
Helping users surface meaningful insights
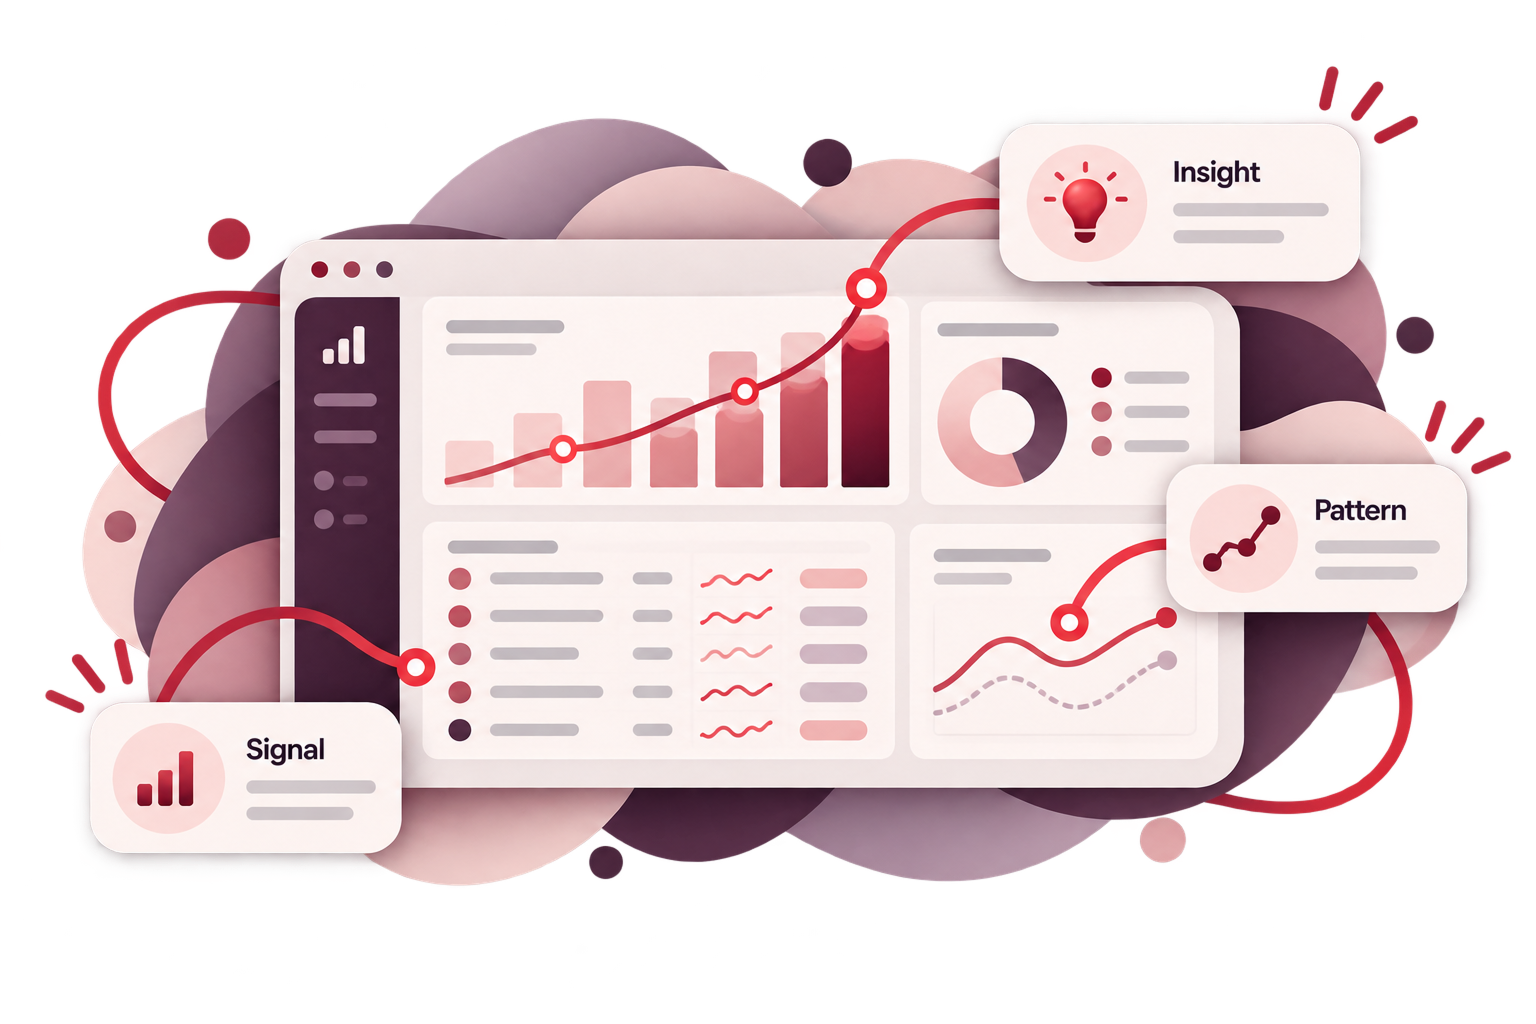
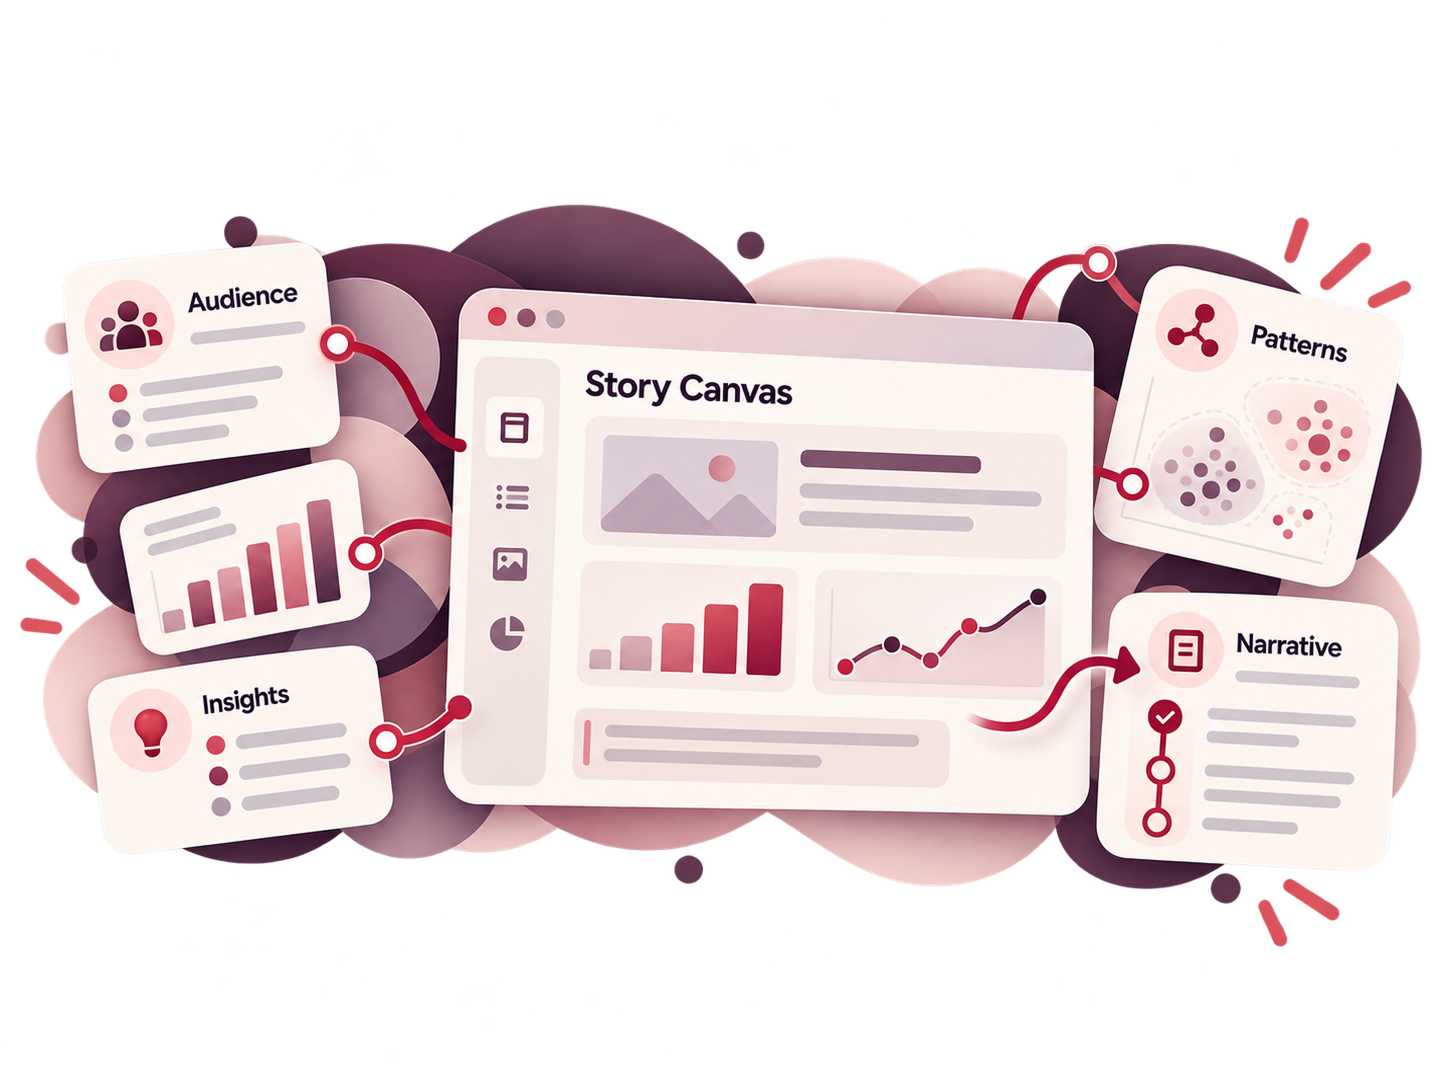
The experience also explored ways to help users recognize noteworthy patterns in complex data.The purpose was not to replace the analyst’s judgment. It was to make important signals easier to notice and give users a stronger starting point for deeper exploration.
INSIDE THE ENGAGEMENT
What the work actually involved
This project crossed research, product strategy, information architecture, and interaction design.The work focused on understanding the complete analytical journey: how people entered the platform, explored information, recognized useful findings, constructed a story, and eventually communicated that story to someone else.
UX Strategy
Connected the analytical workflow, user needs, and product opportunities into a clearer experience direction.
Research & Discovery
Examined how different users worked with data, where they struggled, and what they needed from the platform.
Persona Development
Captured meaningful differences in user goals, behaviors, and levels of analytical experience.
Customer Journey Mapping
Mapped the broader journey from exploration through interpretation, storytelling, and action.
Information Architecture
Organized features and information around the way users actually moved through the work.
Product Design
Translated the strategy into concepts, workflows, interfaces, and iterative product designs.

WHAT CHANGED
A clearer path from data to decision
The biggest shift was that the product began supporting more of the work that happened after someone found an interesting data point.
Better continuity across the workflow
Users could move more naturally from exploration into organizing and interpreting what they had found.
Stronger support for storytelling
Insights could be captured and shaped into a more coherent narrative instead of remaining disconnected charts or observations.
More useful guidance
The experience created opportunities to help users recognize important patterns and understand where deeper analysis might be valuable.
Great analytics UX is not just about presenting information.
It is about helping people think with it.
This work looked beyond individual dashboards and visualizations to the larger experience of exploration, interpretation, storytelling, and decision-making. By connecting those parts of the journey, the product could do more than show users what the data said. It could help them understand why it mattered and what to do with it.
Tell me what you're trying to improve.
You do not need to diagnose the UX problem first. Start with what you are seeing, what customers are telling you, or what you want the website or product to accomplish.